GDOS Tutorial
Complete guide to using the Gene Dosage Sensitivity Database for genomic research and analysis.

Search engine

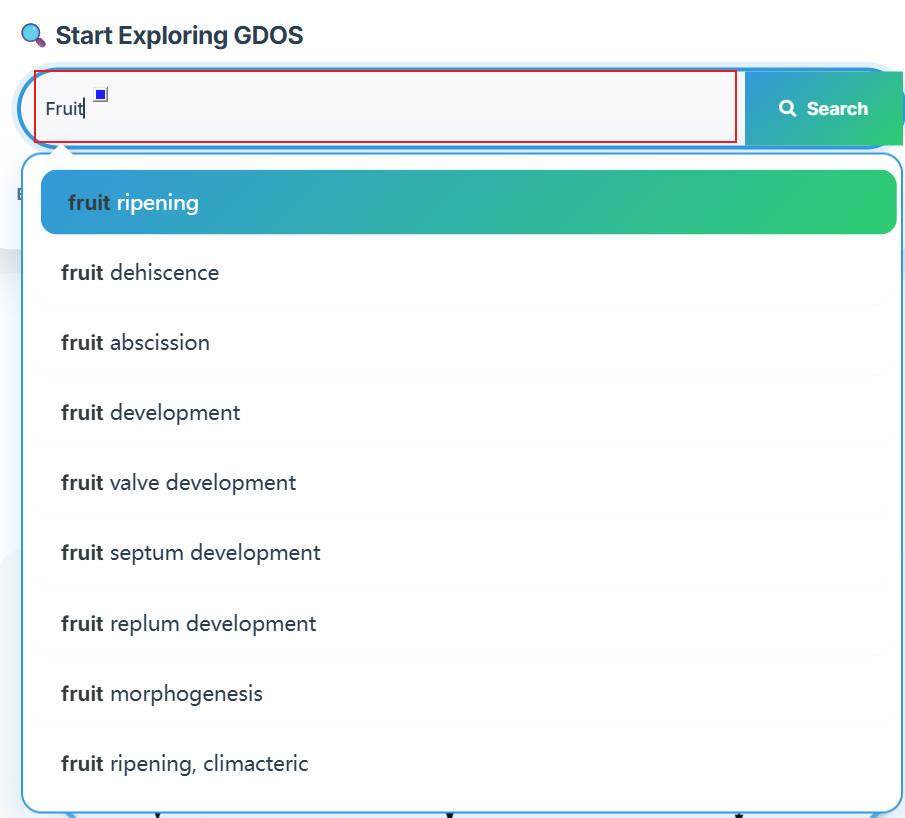
The homepage search engine is a real-time intelligent retrieval system that supports various input types, including gene IDs, Arabidopsis thaliana IDs, GO terms, and functional descriptions. The minimum query string length is 2 characters. For example, to search for fruit ripening-related content, users can input "Frui" (4 characters), and the interface will instantly return the most relevant matches. After selecting the desired entry, pressing Enter twice will execute the search and automatically redirect to the results page.
Search Engine
Figure 1: GDOS Search Engine Interface

Species Browse

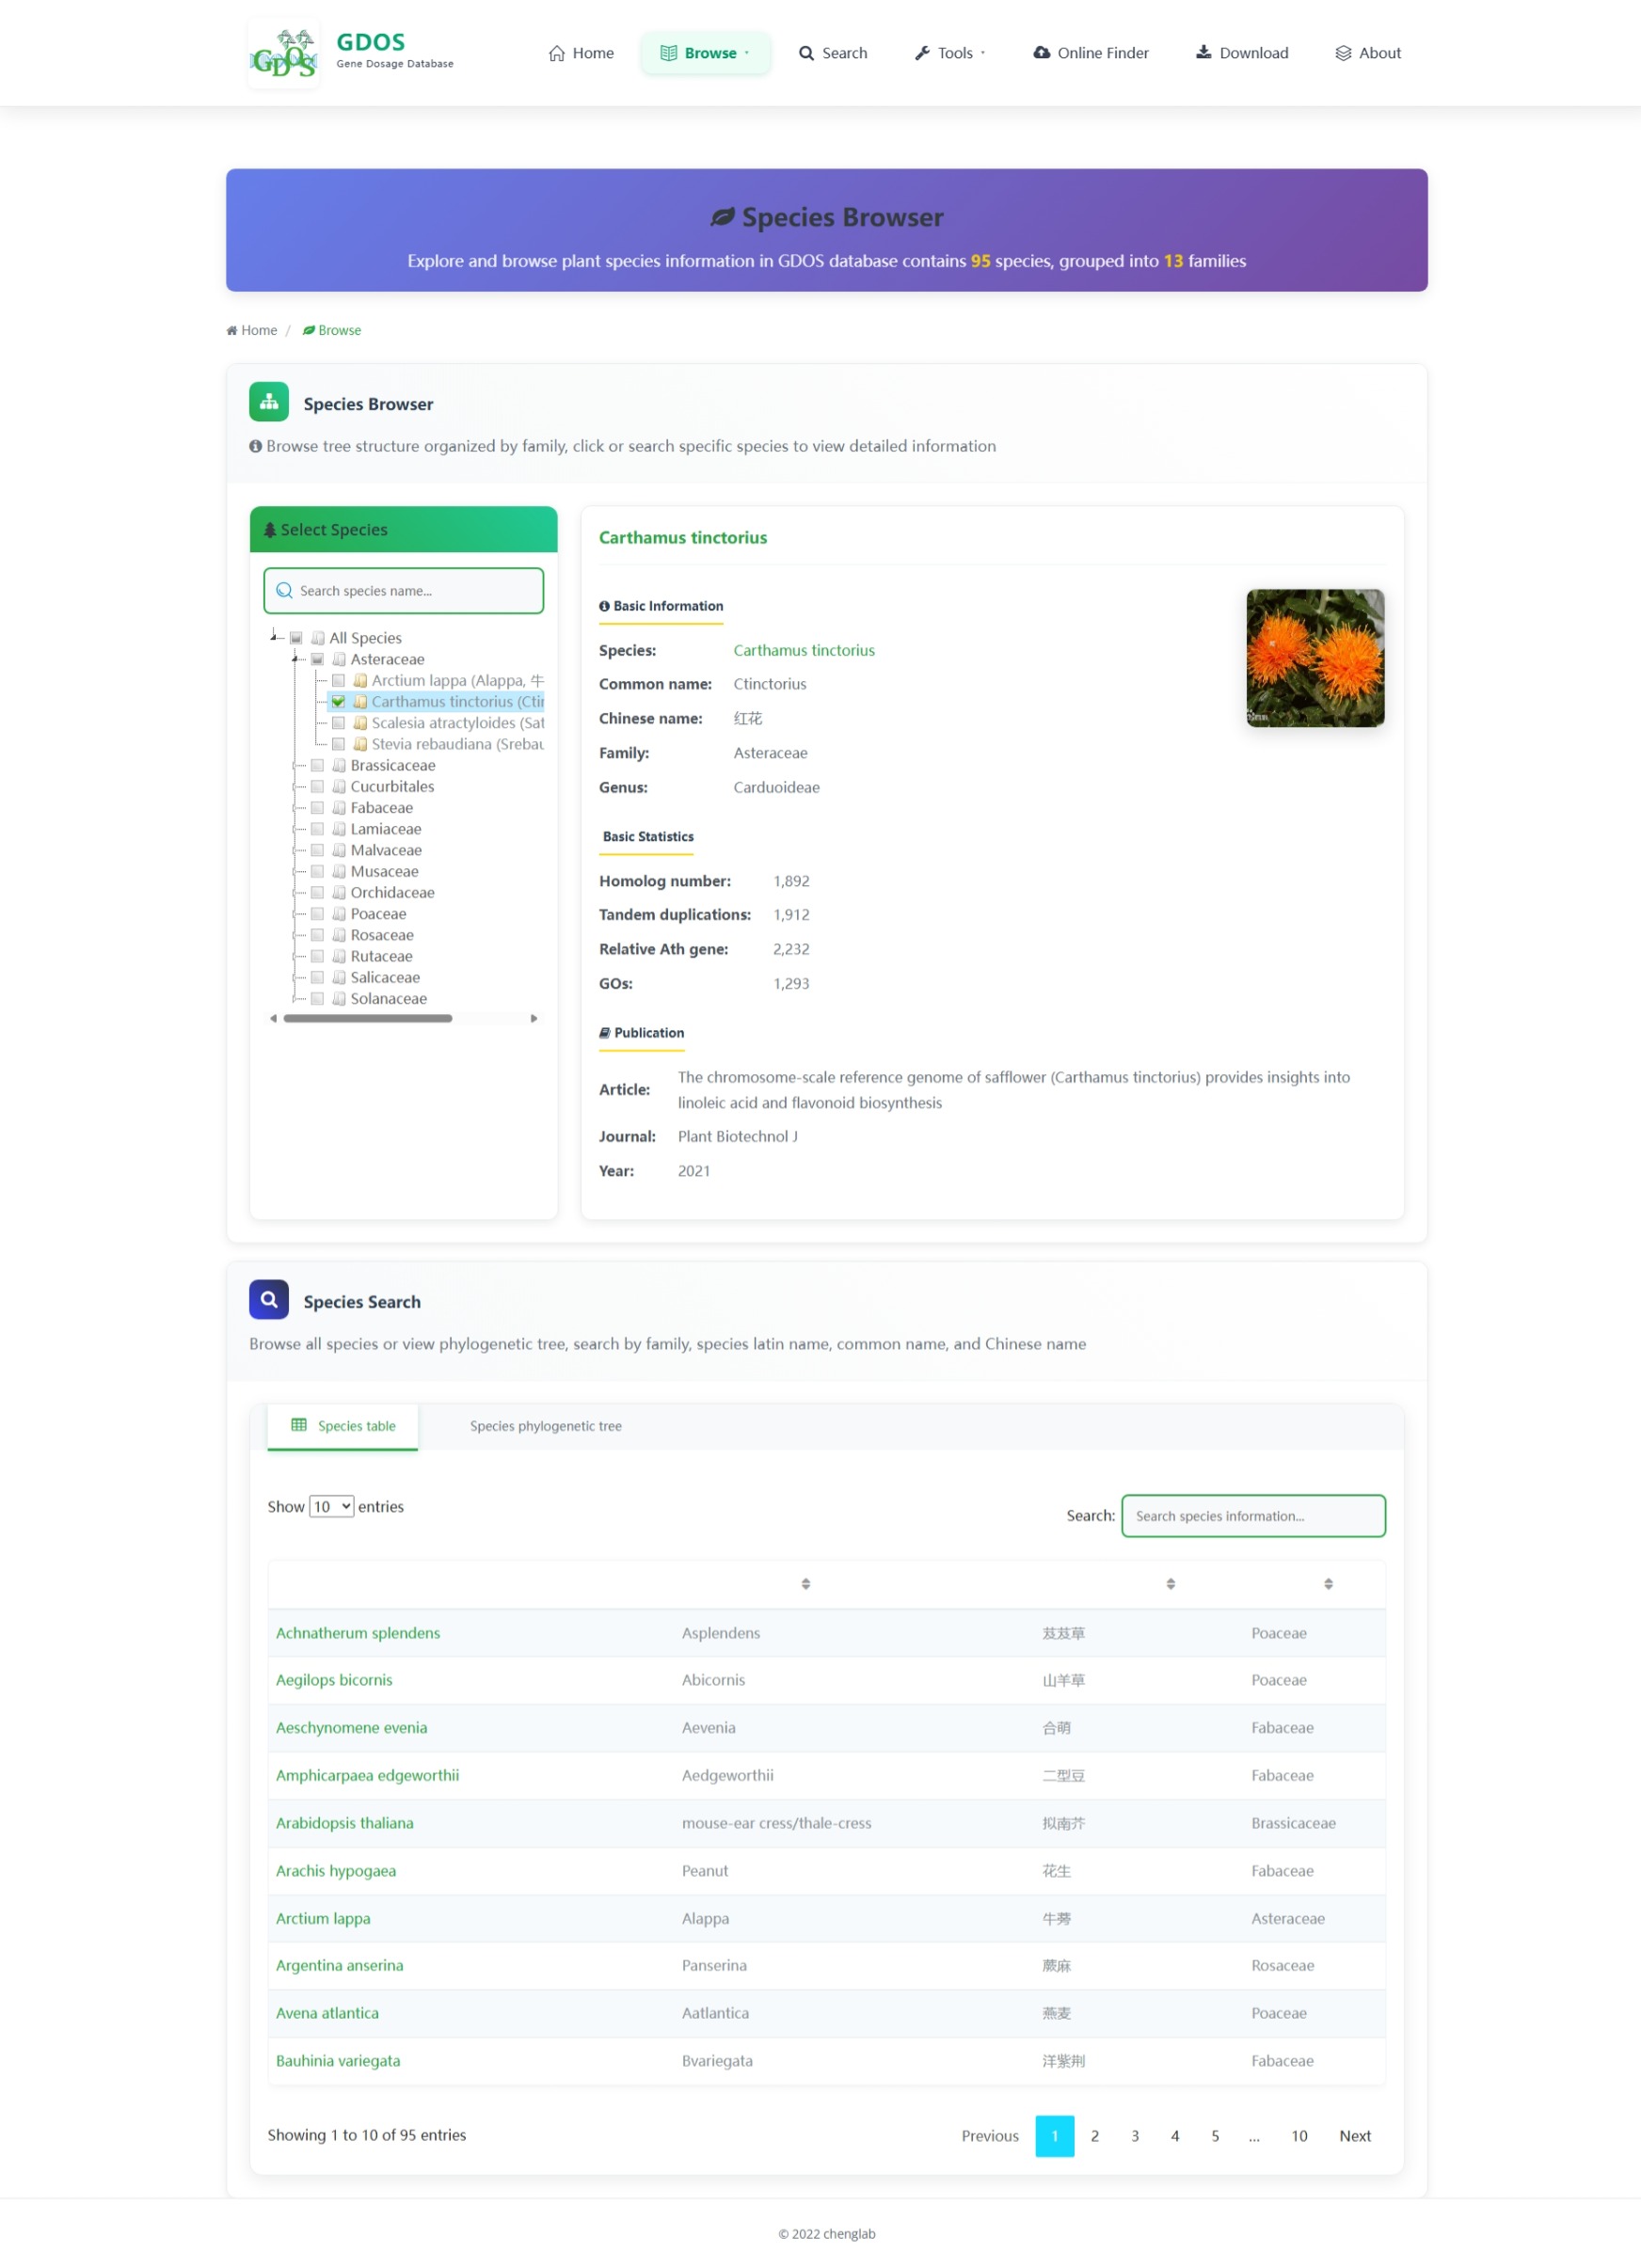
The Species Browser page provides a comprehensive catalog of all plant species utilized in the GDOS database, enabling users to gain a thorough understanding of the database's overall data composition. This functionality comprises two primary components: Component 1: Species Information Panel The first component presents essential species information alongside statistical descriptors of identified dosage genes and corresponding genomic references. This section features a hierarchical tree-folder structure that supports dual navigation methods: Search-based retrieval: Direct input search functionality Folder-based browsing: Hierarchical navigation through taxonomic categories Both methods allow users to access specific species genomic information efficiently. Component 2: Species Overview Table The second component consists of a comprehensive species details table that consolidates information for all species within the GDOS database. Key features include: Keyword search functionality: Full-text search capabilities across all table fields Interactive hyperlinks: Species Latin names are configured as clickable links that direct users to the corresponding Species Dosage Gene Details page (detailed description provided below) Complete species coverage: Comprehensive overview of all database entries This dual-component architecture ensures both detailed species exploration and broad database overview capabilities, facilitating efficient data discovery and analysis workflows.

Species Browse Page
Figure 2: Species Browse Page Interface

Species Dosage Detail

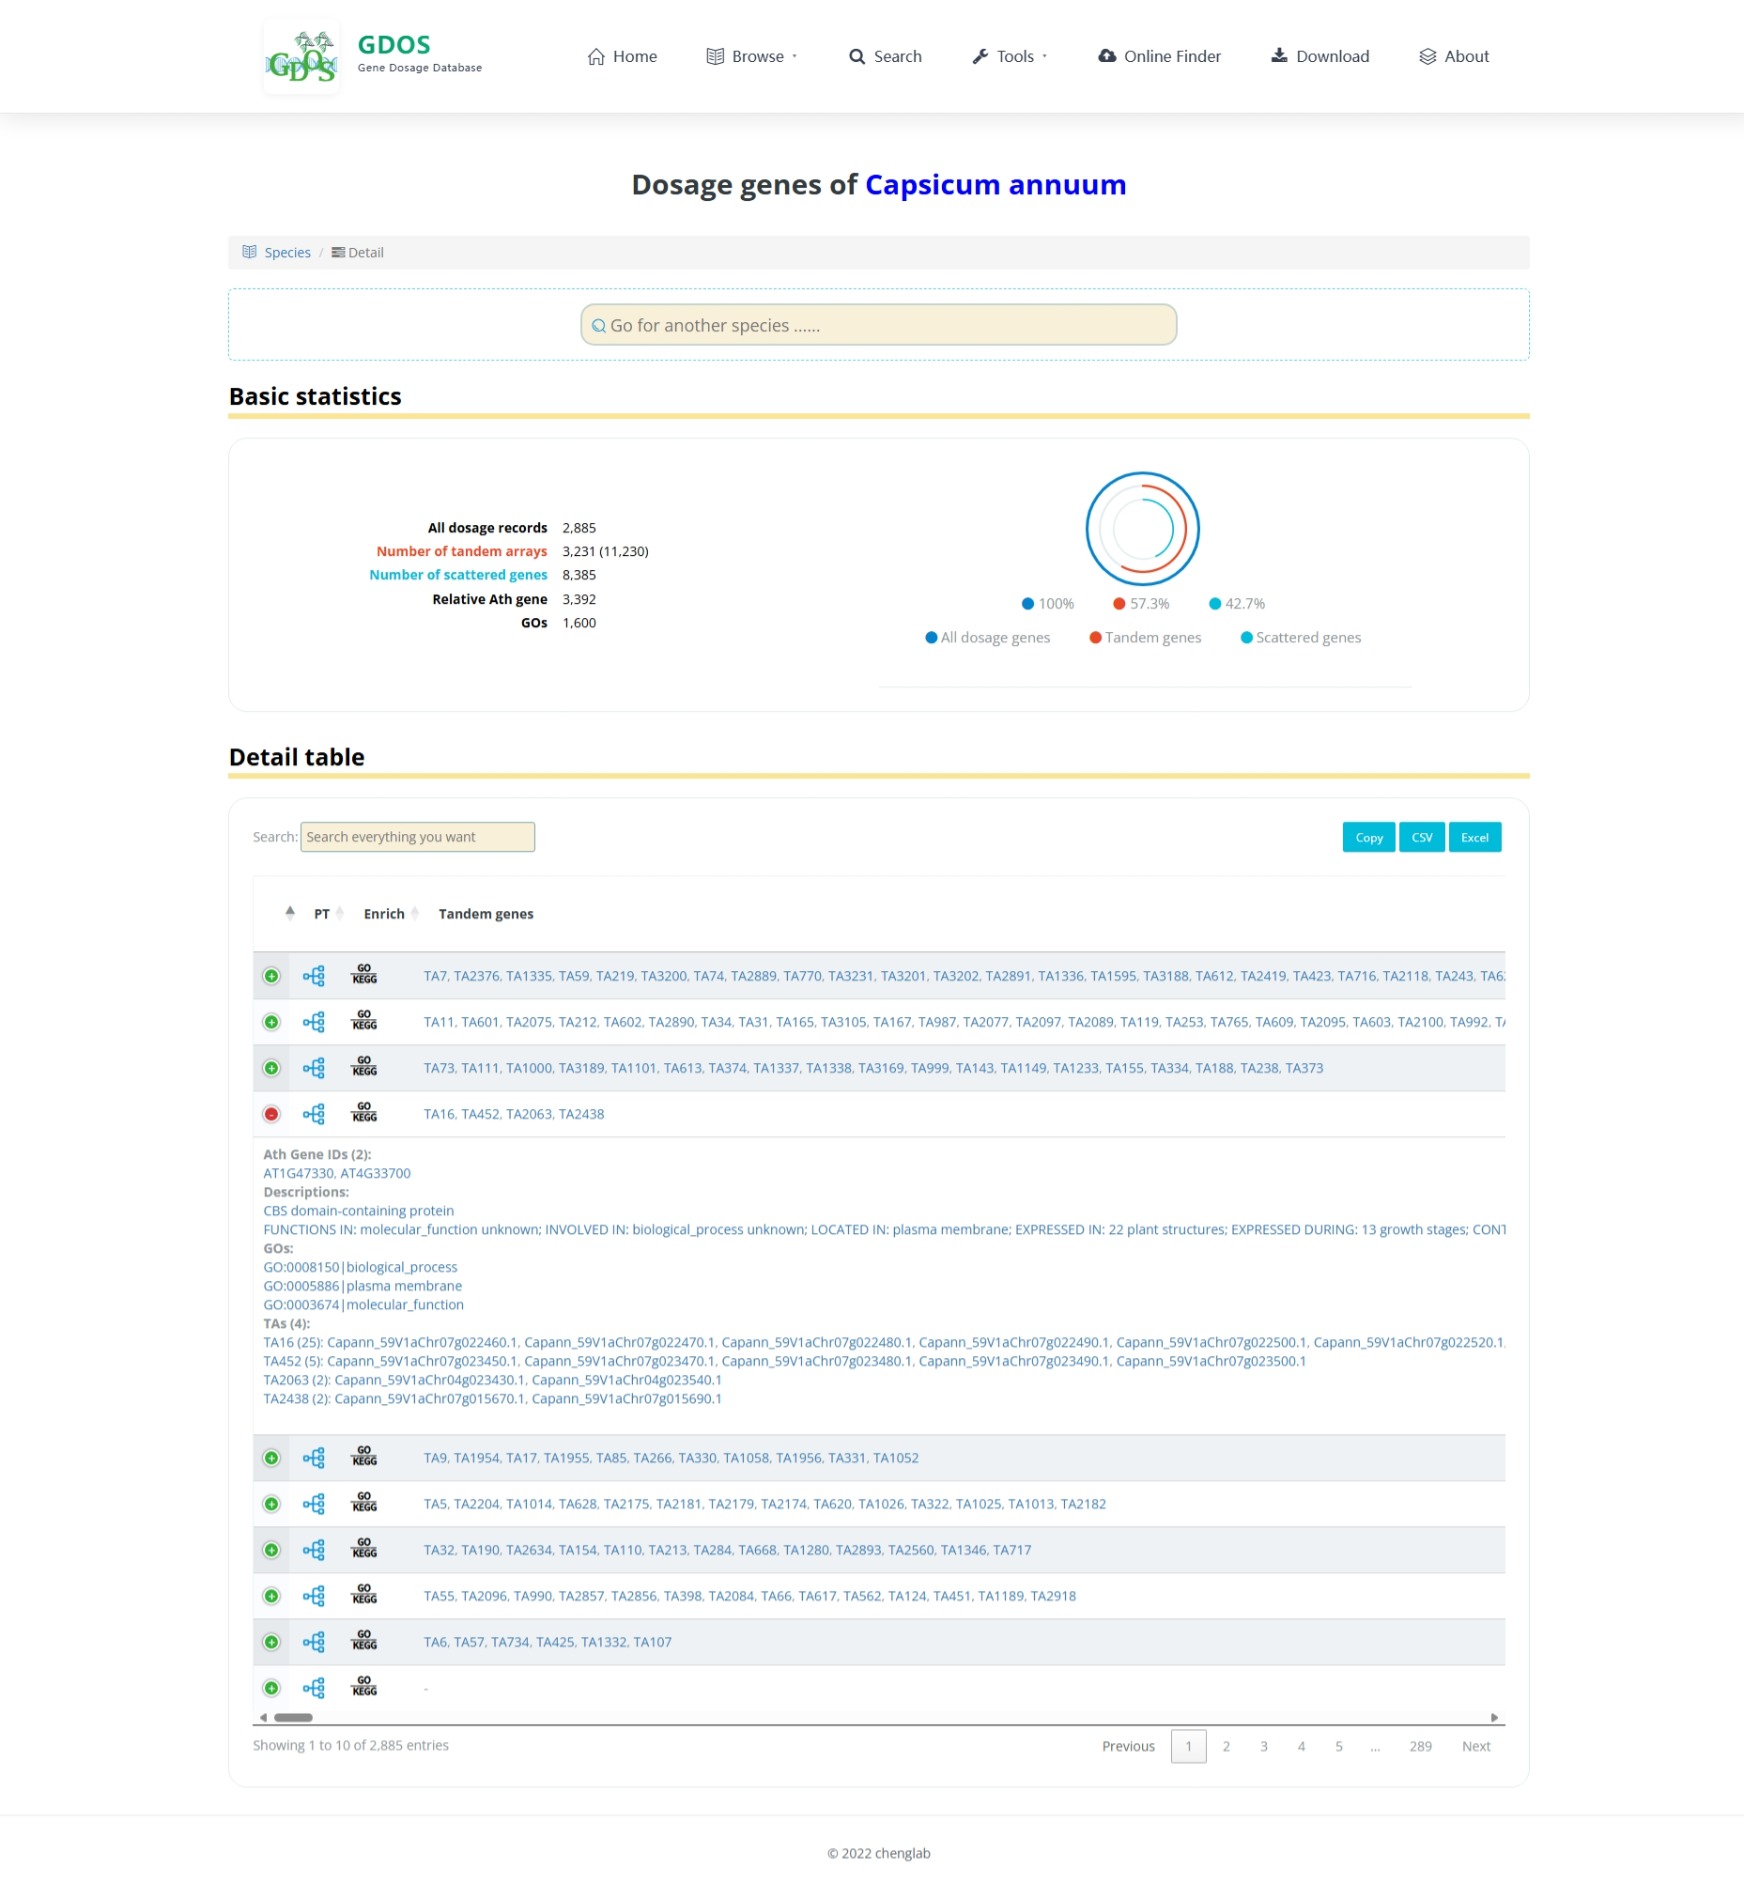
Species-Specific Dosage Gene Detail Page: This page helps users systematically explore gene copy number and tandem duplication patterns within a single species. Users can browse all dosage-sensitive genes identified in the selected species and click the plus icon in the first column of the table to view detailed information for each gene. Additionally, the second and third columns provide direct links to automated tools for phylogenetic tree construction and GO/KEGG enrichment analysis, allowing one-click execution of relevant analyses based on gene copies.

Species Dosage Detail
Figure 3: Species Dosage Detail Page

Statistics Page

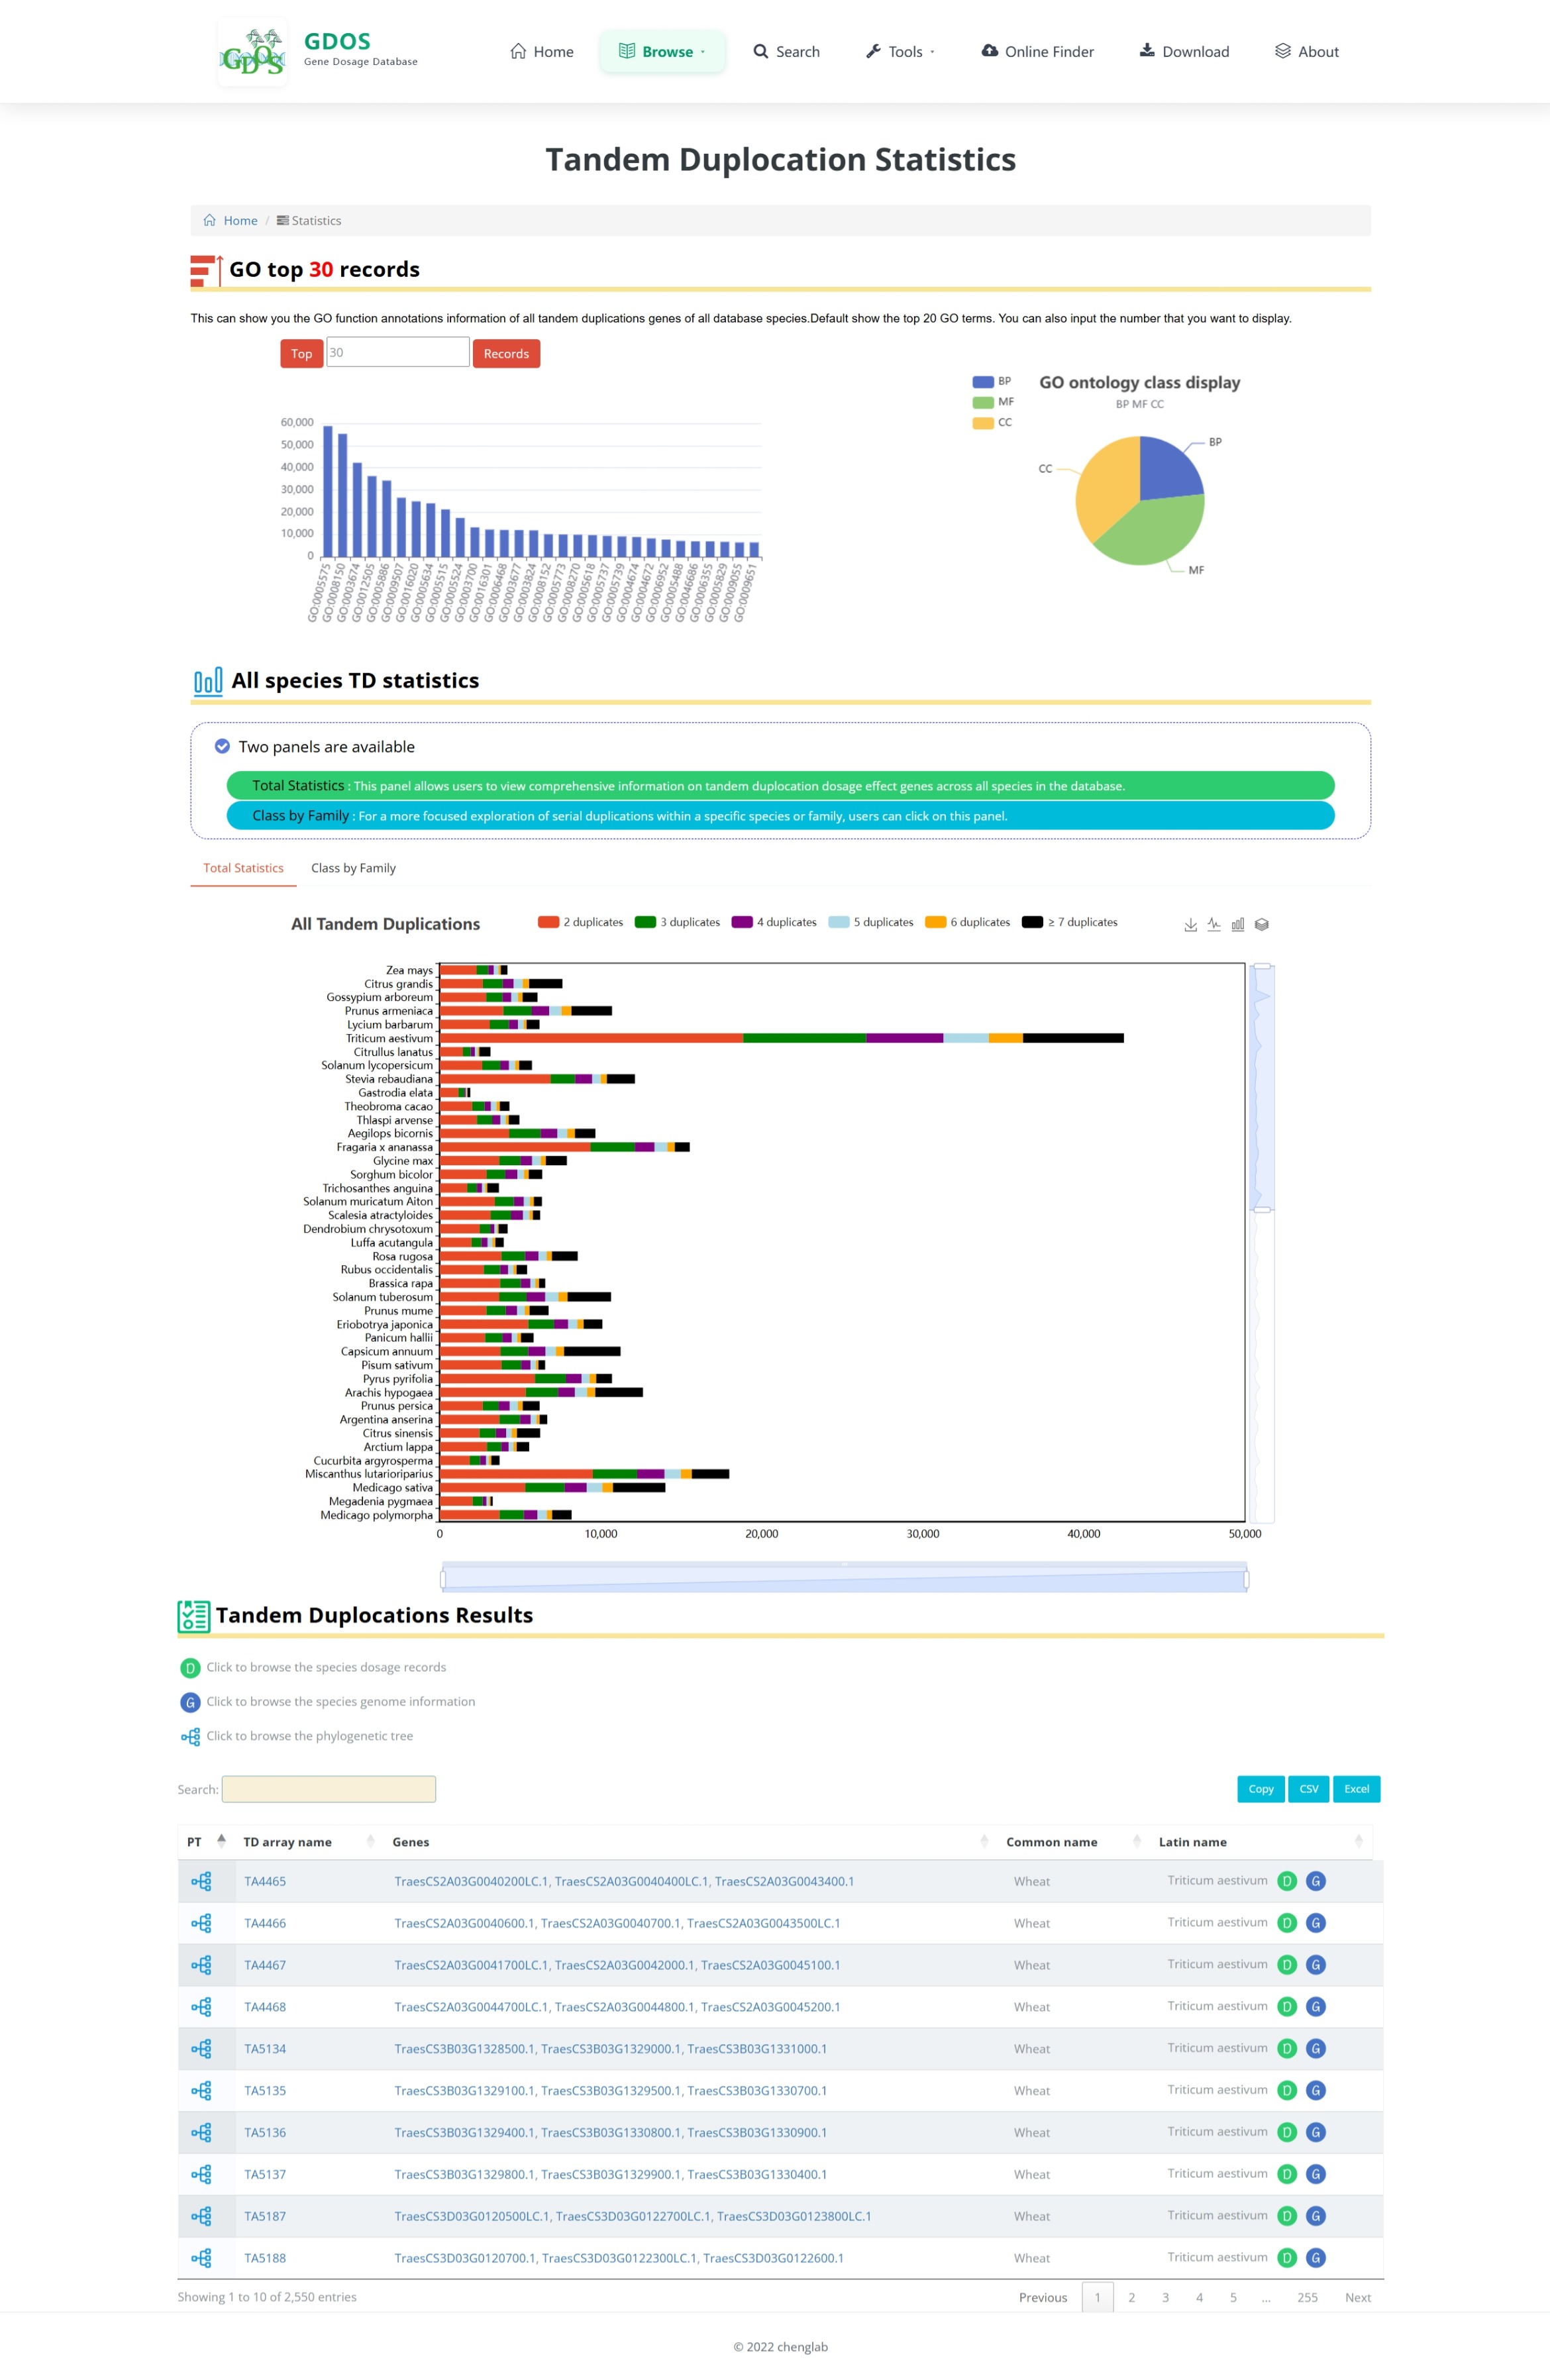
The Statistics page provides a comprehensive overview of all GO terms annotated across species in the current database. It also features interactive bar charts visualizing the distribution of tandemly duplicated gene clusters among all stored species. Different colors represent varying numbers of tandem duplication types. Users can click on each colored bar to access the corresponding set of detailed tandem duplication gene results.

Statistics Page
Figure 4: Statistics Page Interface

Report Cases

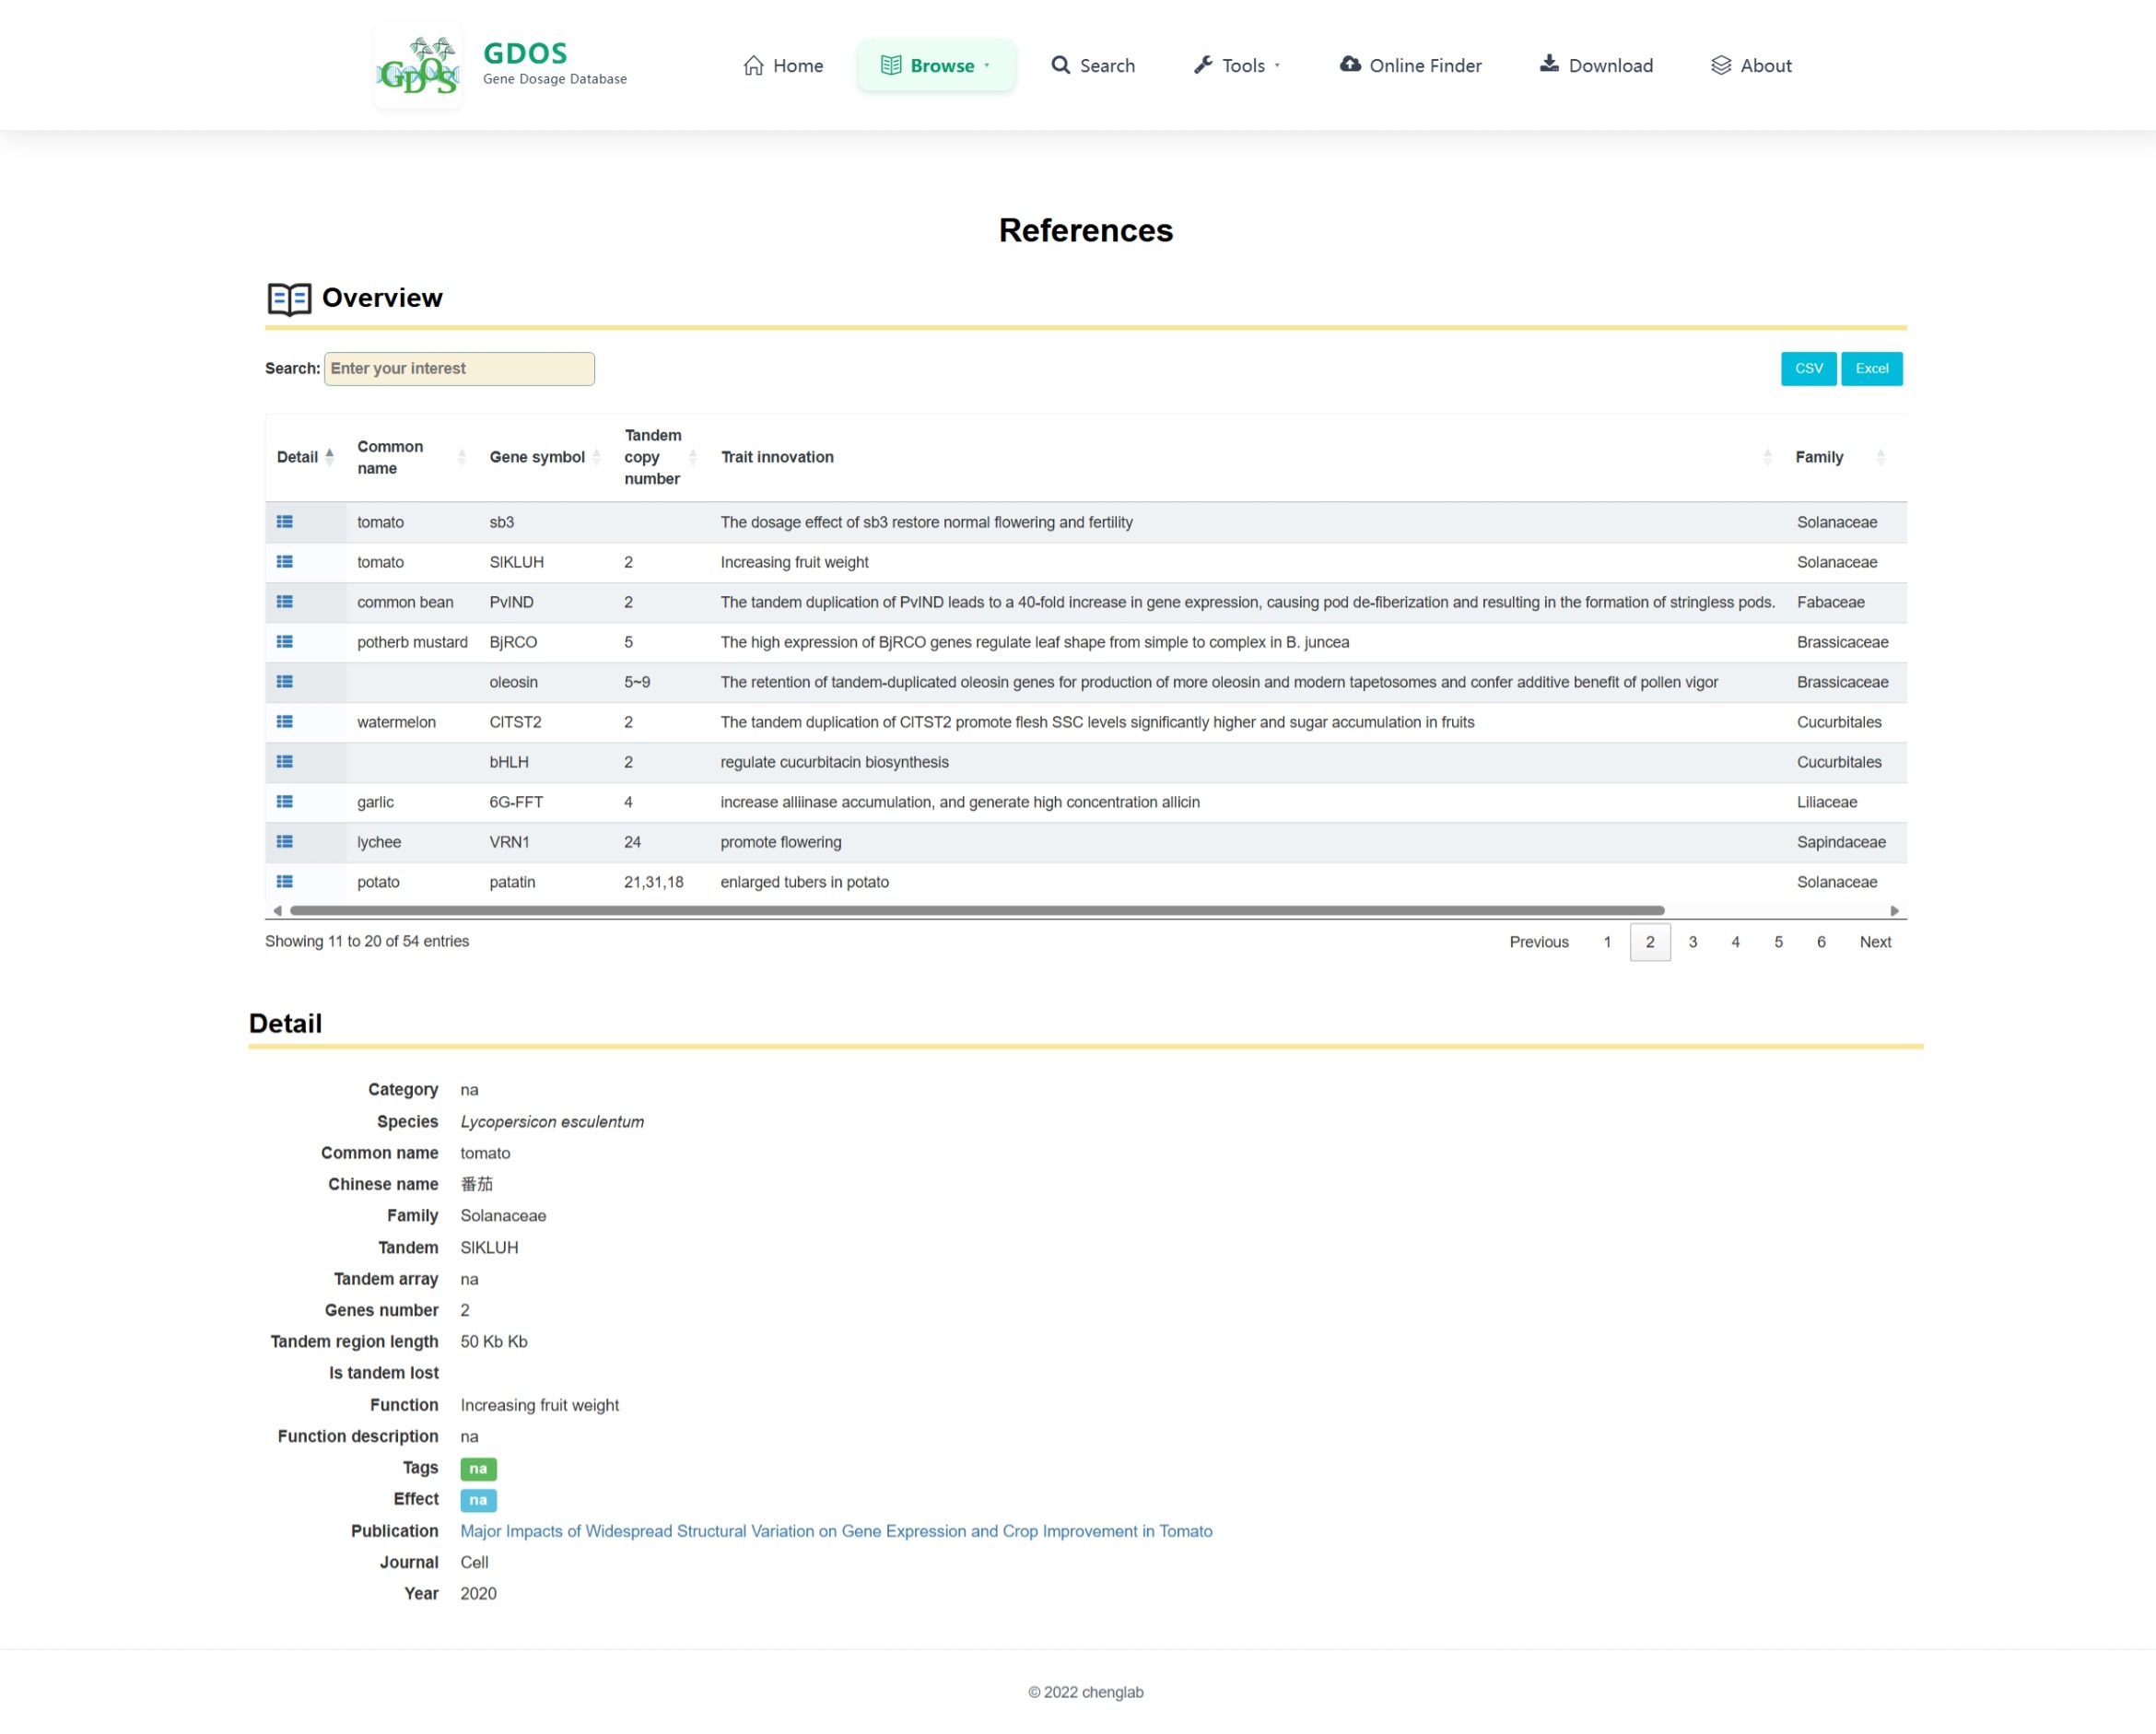
In the "Reported Cases" section, we have curated and organized recently published studies highlighting the roles of gene dosage in plant traits, domestication, adaptive evolution, and stress responses. This section is presented primarily in a tabular format, where each row corresponds to a reported case. Users can click on the first column of each row to access detailed information about the associated publication.

Report Cases
Figure 5: Report Cases Page

Search Page

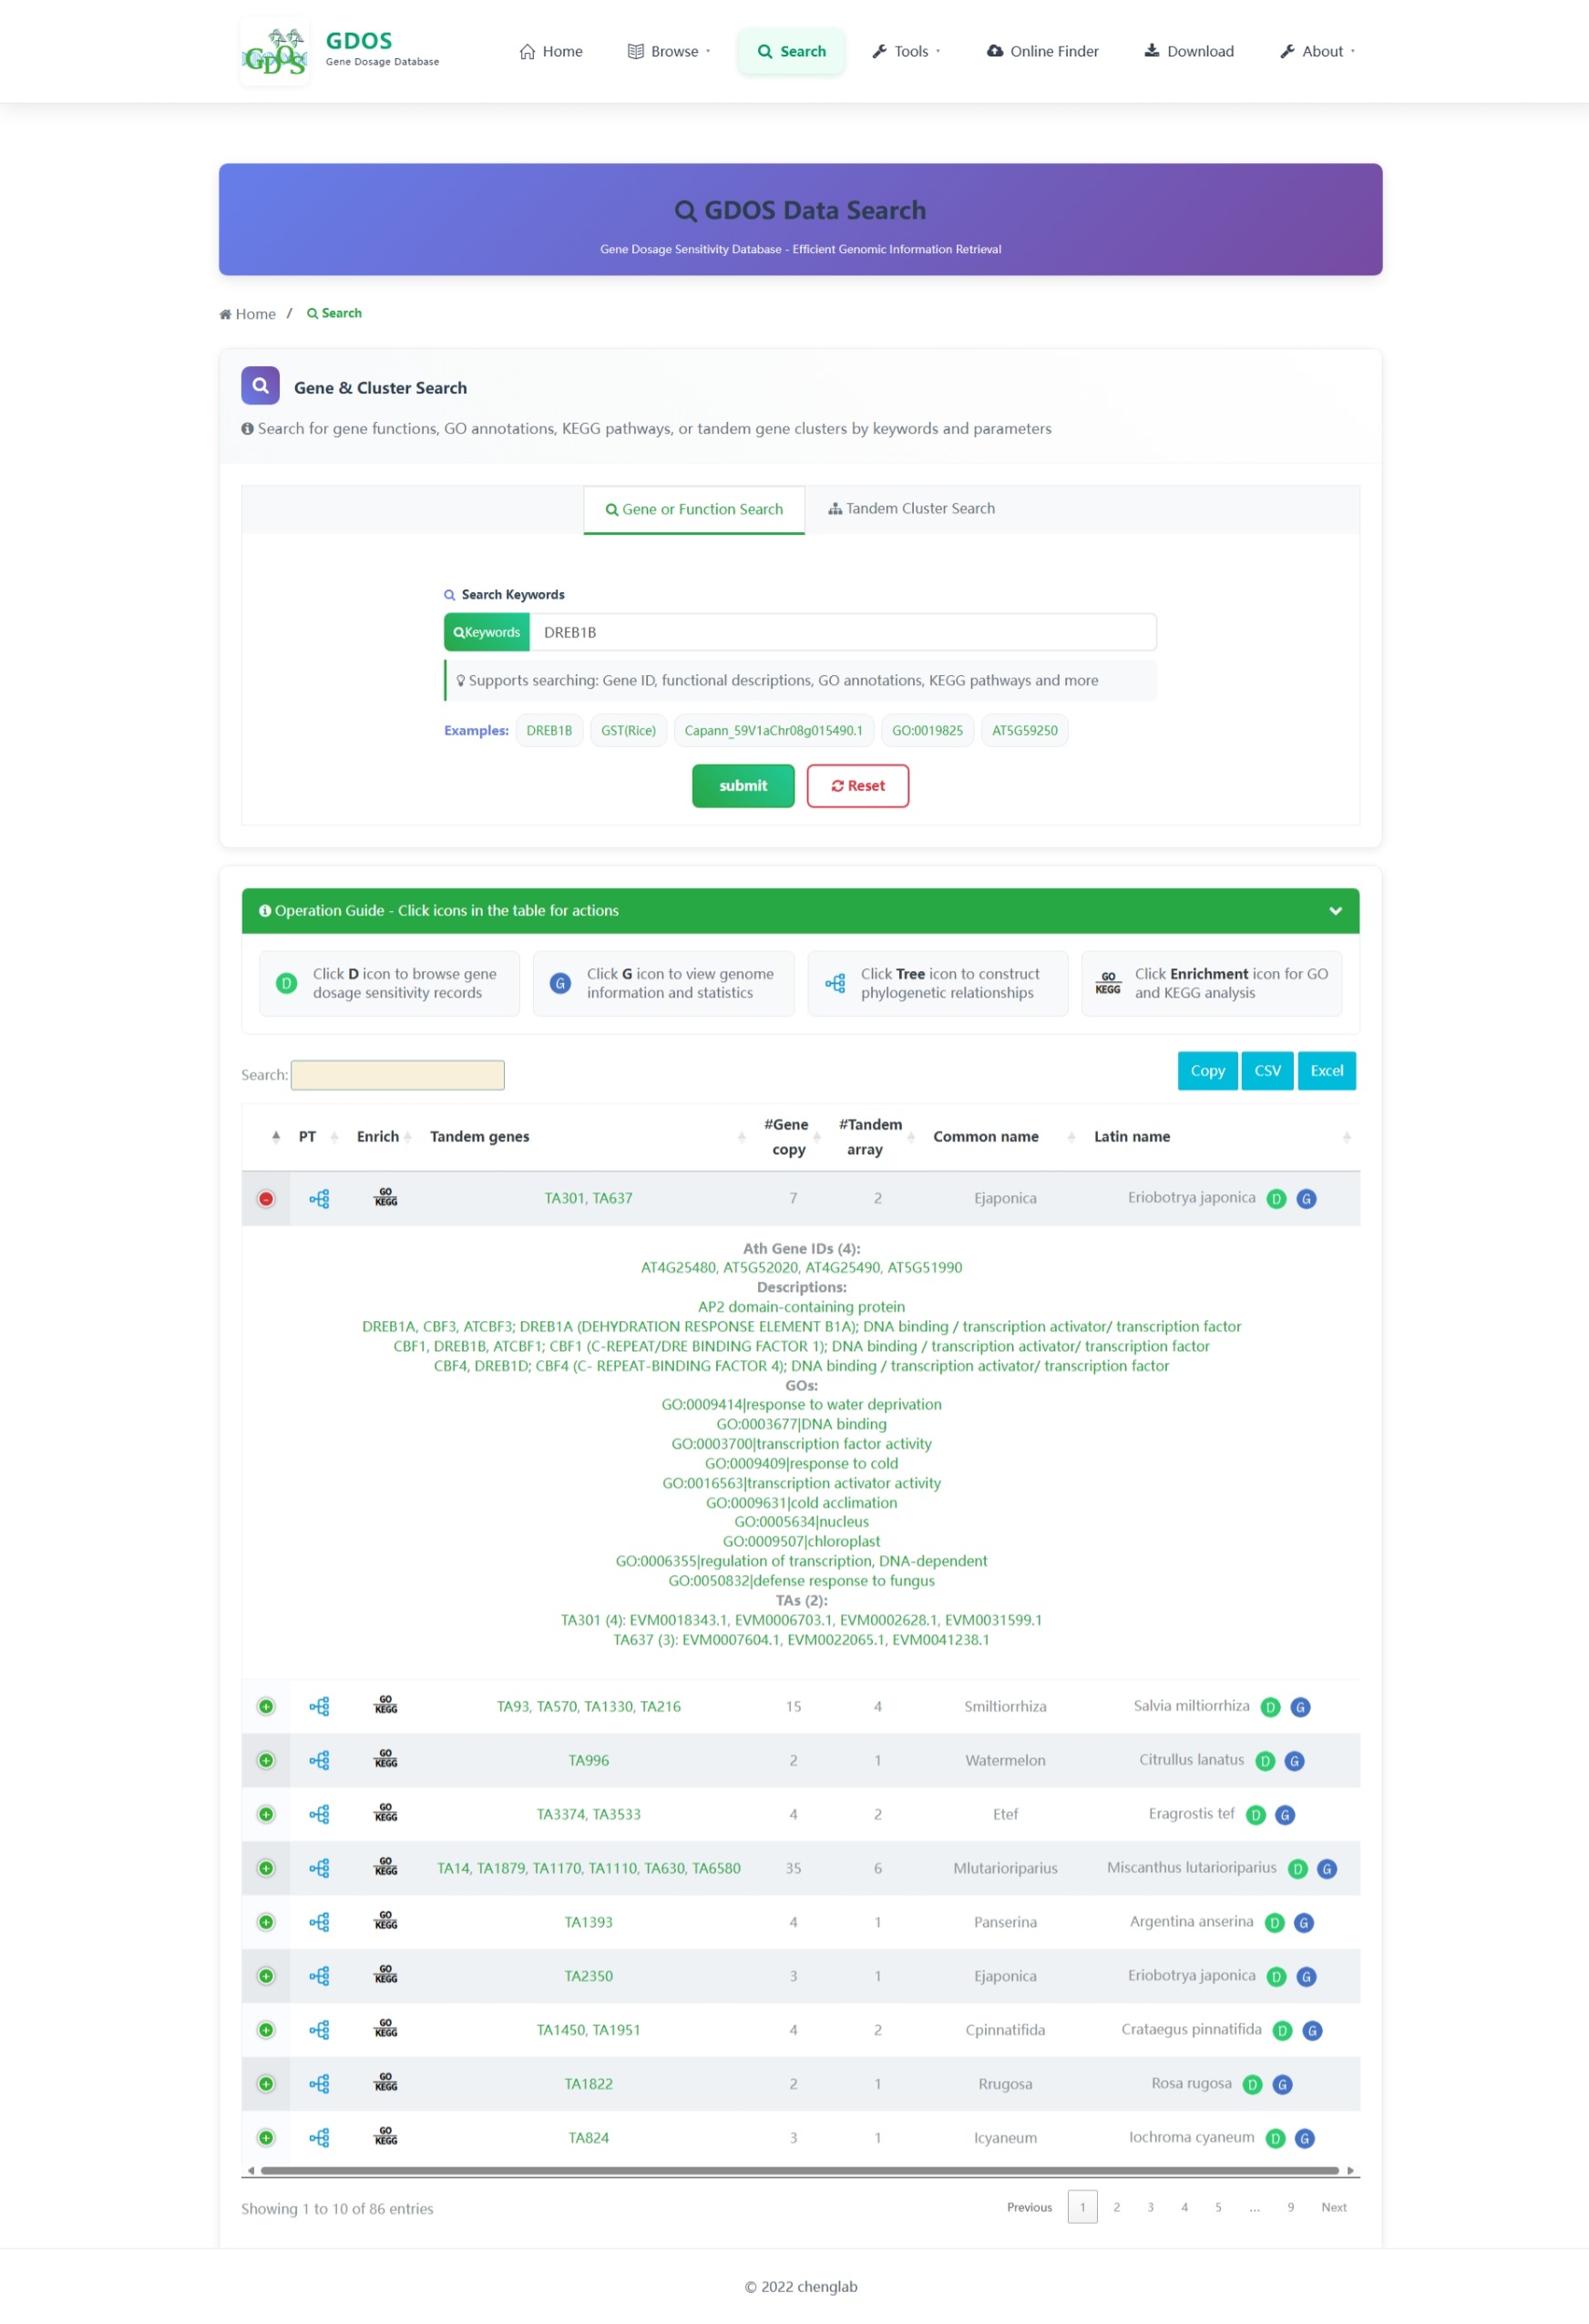
The Search Function page enables users to efficiently retrieve genes of interest. It supports two types of queries: one based on gene IDs, GO terms, or functional annotations, and another based on the number of tandemly duplicated gene clusters. The search system is highly flexible, allowing users to specify a target set of species for customized queries. Results are displayed in a structured table format, with integrated shortcut tools for immediate downstream analysis.

Search Page
Figure 6: Search Page Interface

Retrieve Gene

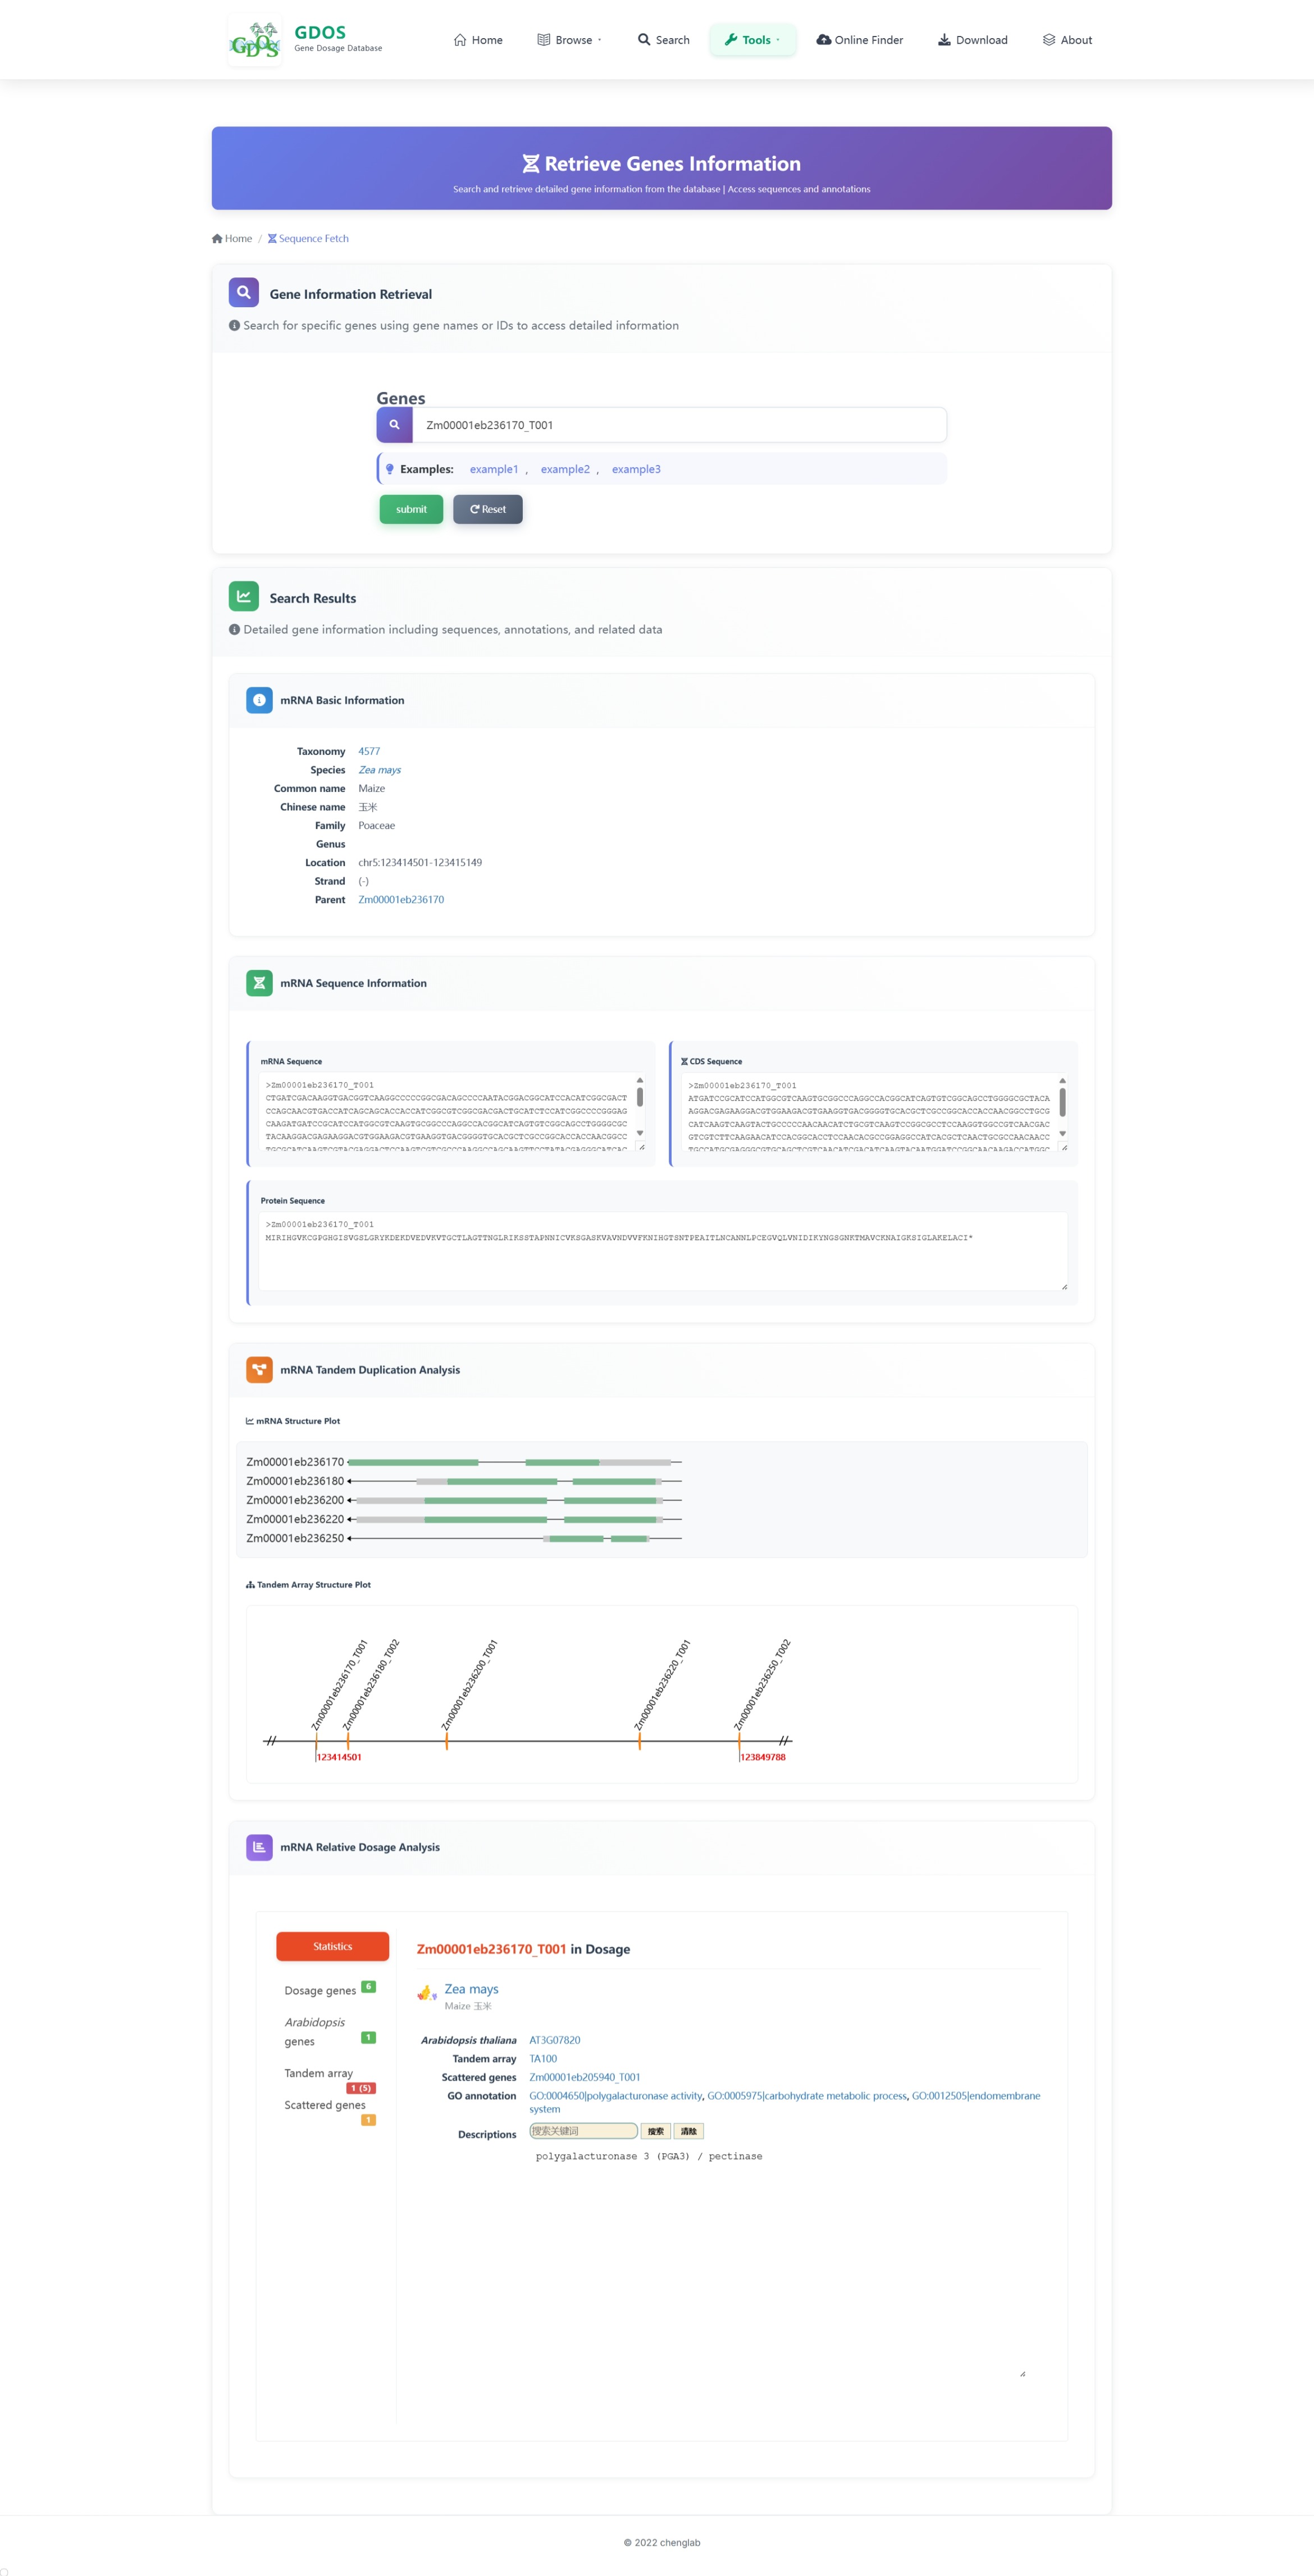
The Gene Search Tool is designed to help users gain targeted insights into a specific gene’s structure, sequence, and functional information. Users can simply input a gene ID or transcript ID without needing to specify the species or genome it belongs to—the system will automatically identify the corresponding species, significantly enhancing user experience. The search results are organized into five main sections. The first three include: (1) basic gene information, (2) gene sequence details, and (3) a visual representation of gene structure. The last two sections are conditionally displayed based on whether the gene is involved in tandem duplication. If the gene is not part of a tandem duplication cluster, these sections are omitted. Otherwise, the results include: (4) a visualization of the chromosomal arrangement of the tandem duplication cluster, and (5) related dosage information.

Gene Detail
Figure 7: Gene Detail Page

GO & KEGG Enrichment Analysis Tool

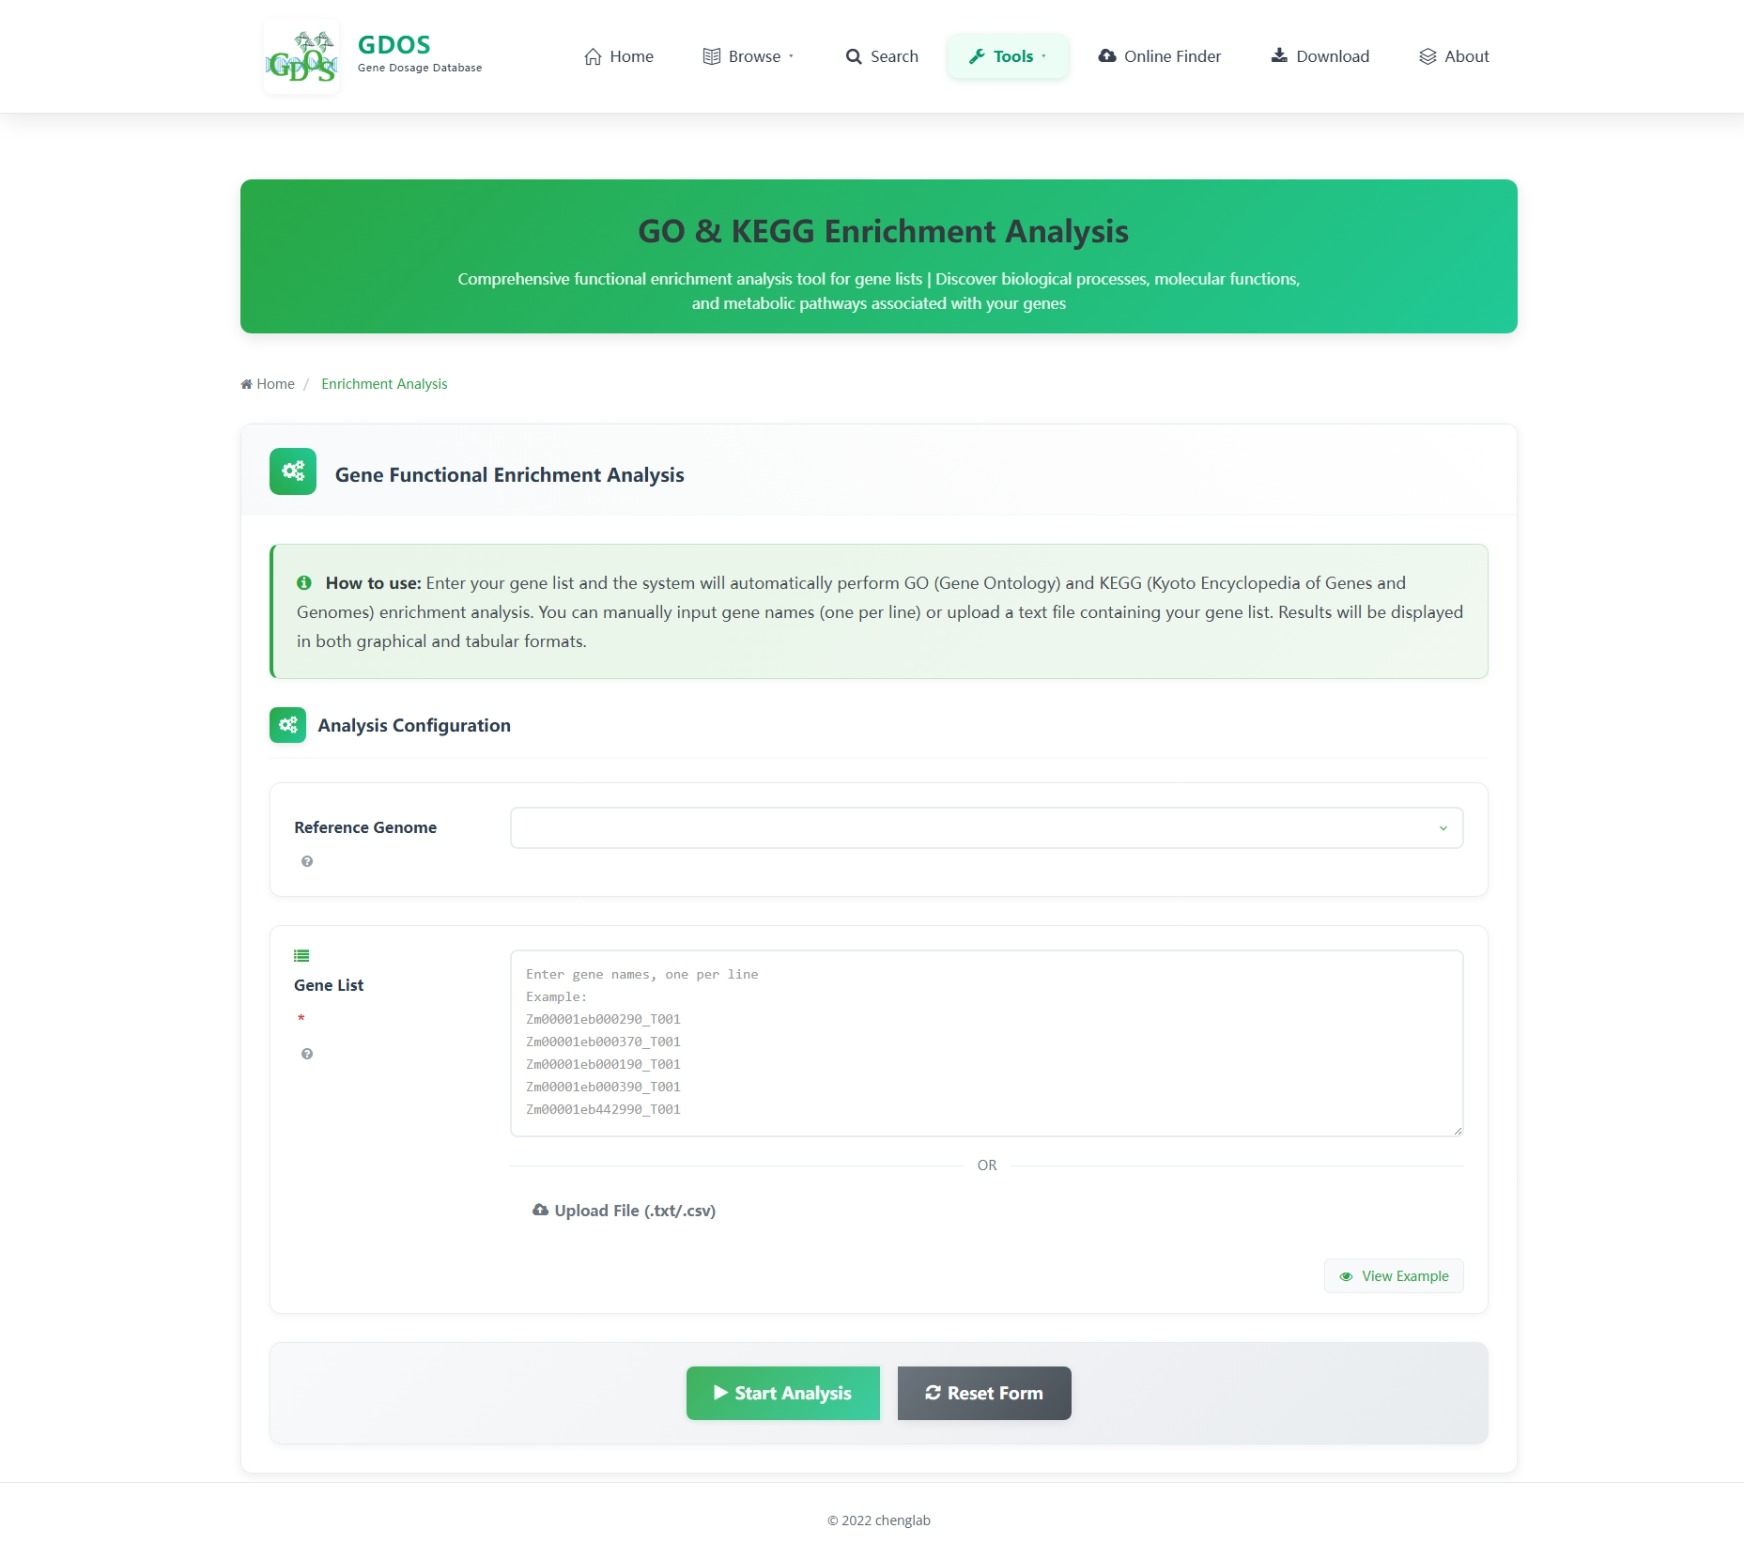
The GO & KEGG Enrichment Analysis Tool is designed to help users better analyze and interpret their data by providing functional and pathway insights. This tool enables users to quickly identify the biological functions and associated pathways of their genes of interest, facilitating a deeper understanding of gene copy variation and its potential biological implications.

GO KEGG Enrichment
Figure 8: GO & KEGG Enrichment Analysis Tool

Dosage Gene Finder

This tool integrates our analysis pipeline into the database as an online analysis module, enabling users to efficiently analyze their own data. Users are required to submit two input files: 1.A protein sequence file of the species in FASTA format, and A gene coordinate file in tab-delimited text format, which must contain five columns: geneID, chromosome, start, end, and strand. 2.The platform also provides a set of customizable analysis parameters. By default, the tool uses a robust parameter configuration optimized for general use, but users can freely adjust these settings to suit their specific needs. Upon completion, the analysis results will be returned to the same page via a downloadable link.

Dosage Gene Finder
Figure 9: Dosage Gene Finder Tool

Gene & Tandem Structure

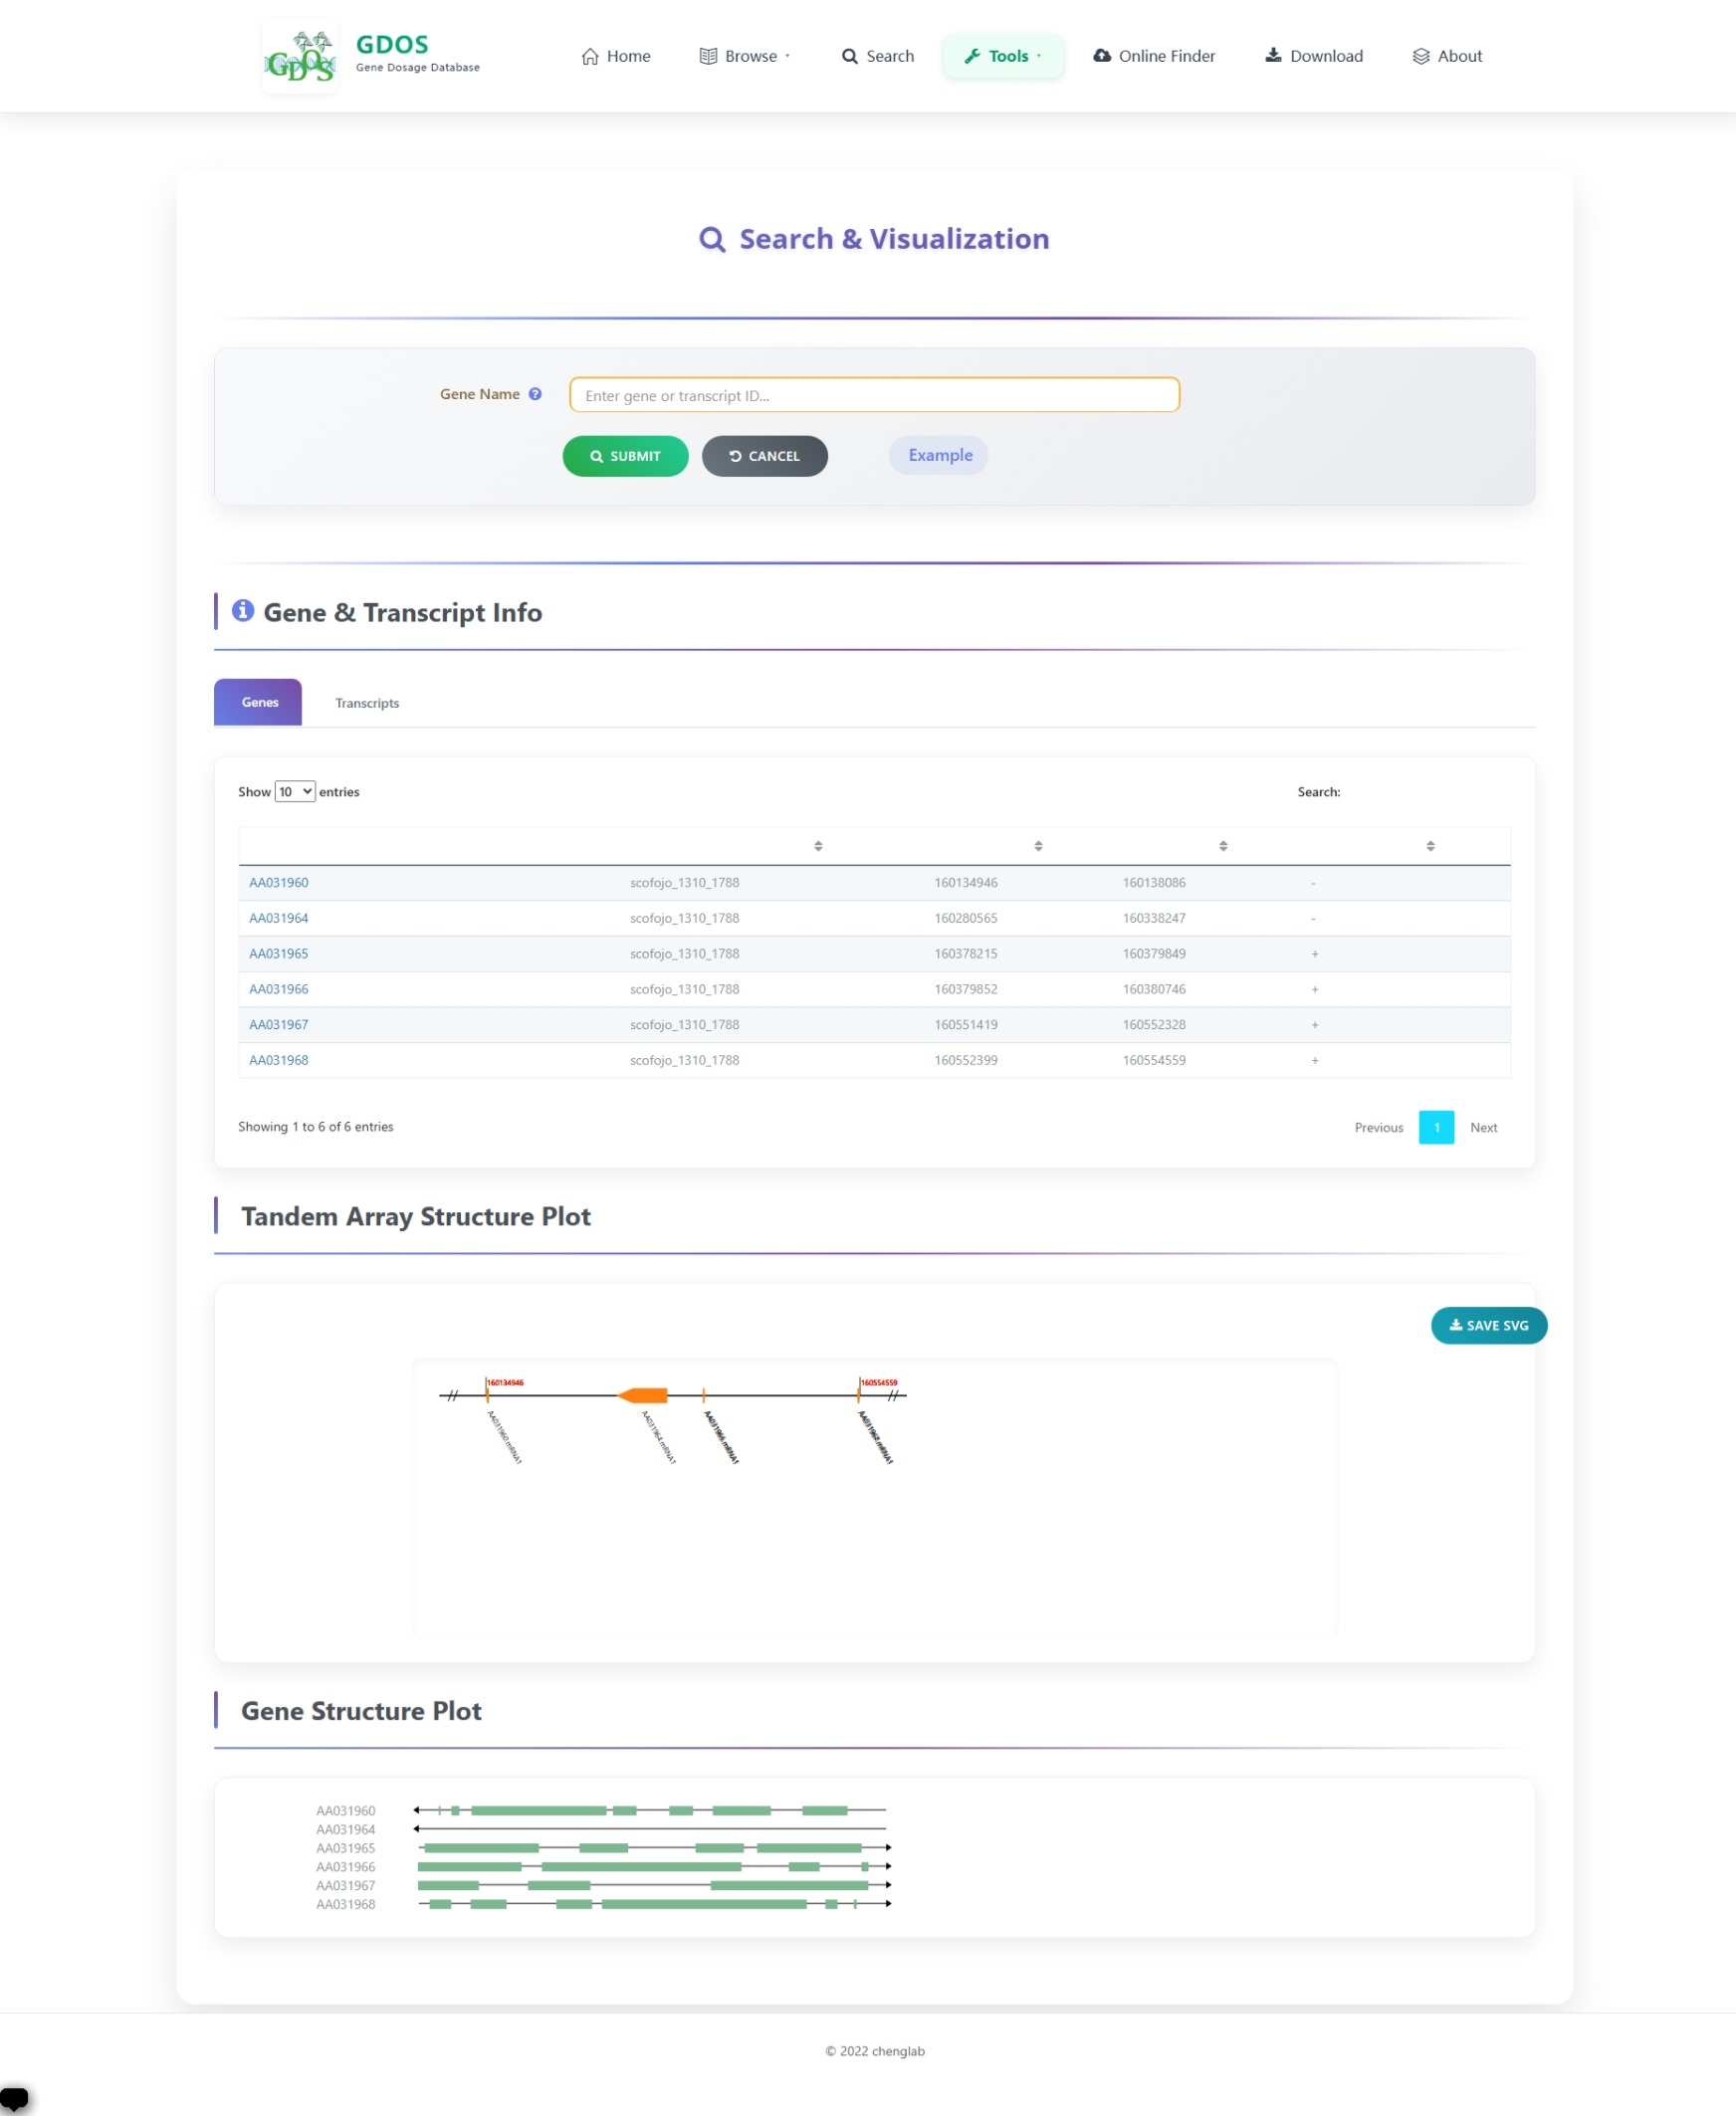
This tool allows users to intuitively explore the spatial organization of genes and their tandem duplications along the chromosomes, providing a clear and informative visual representation of their genomic distribution.

Tandem Structure Visualization
Figure 10: Gene & Tandem Structure Visualization

Family Tandem Distribution

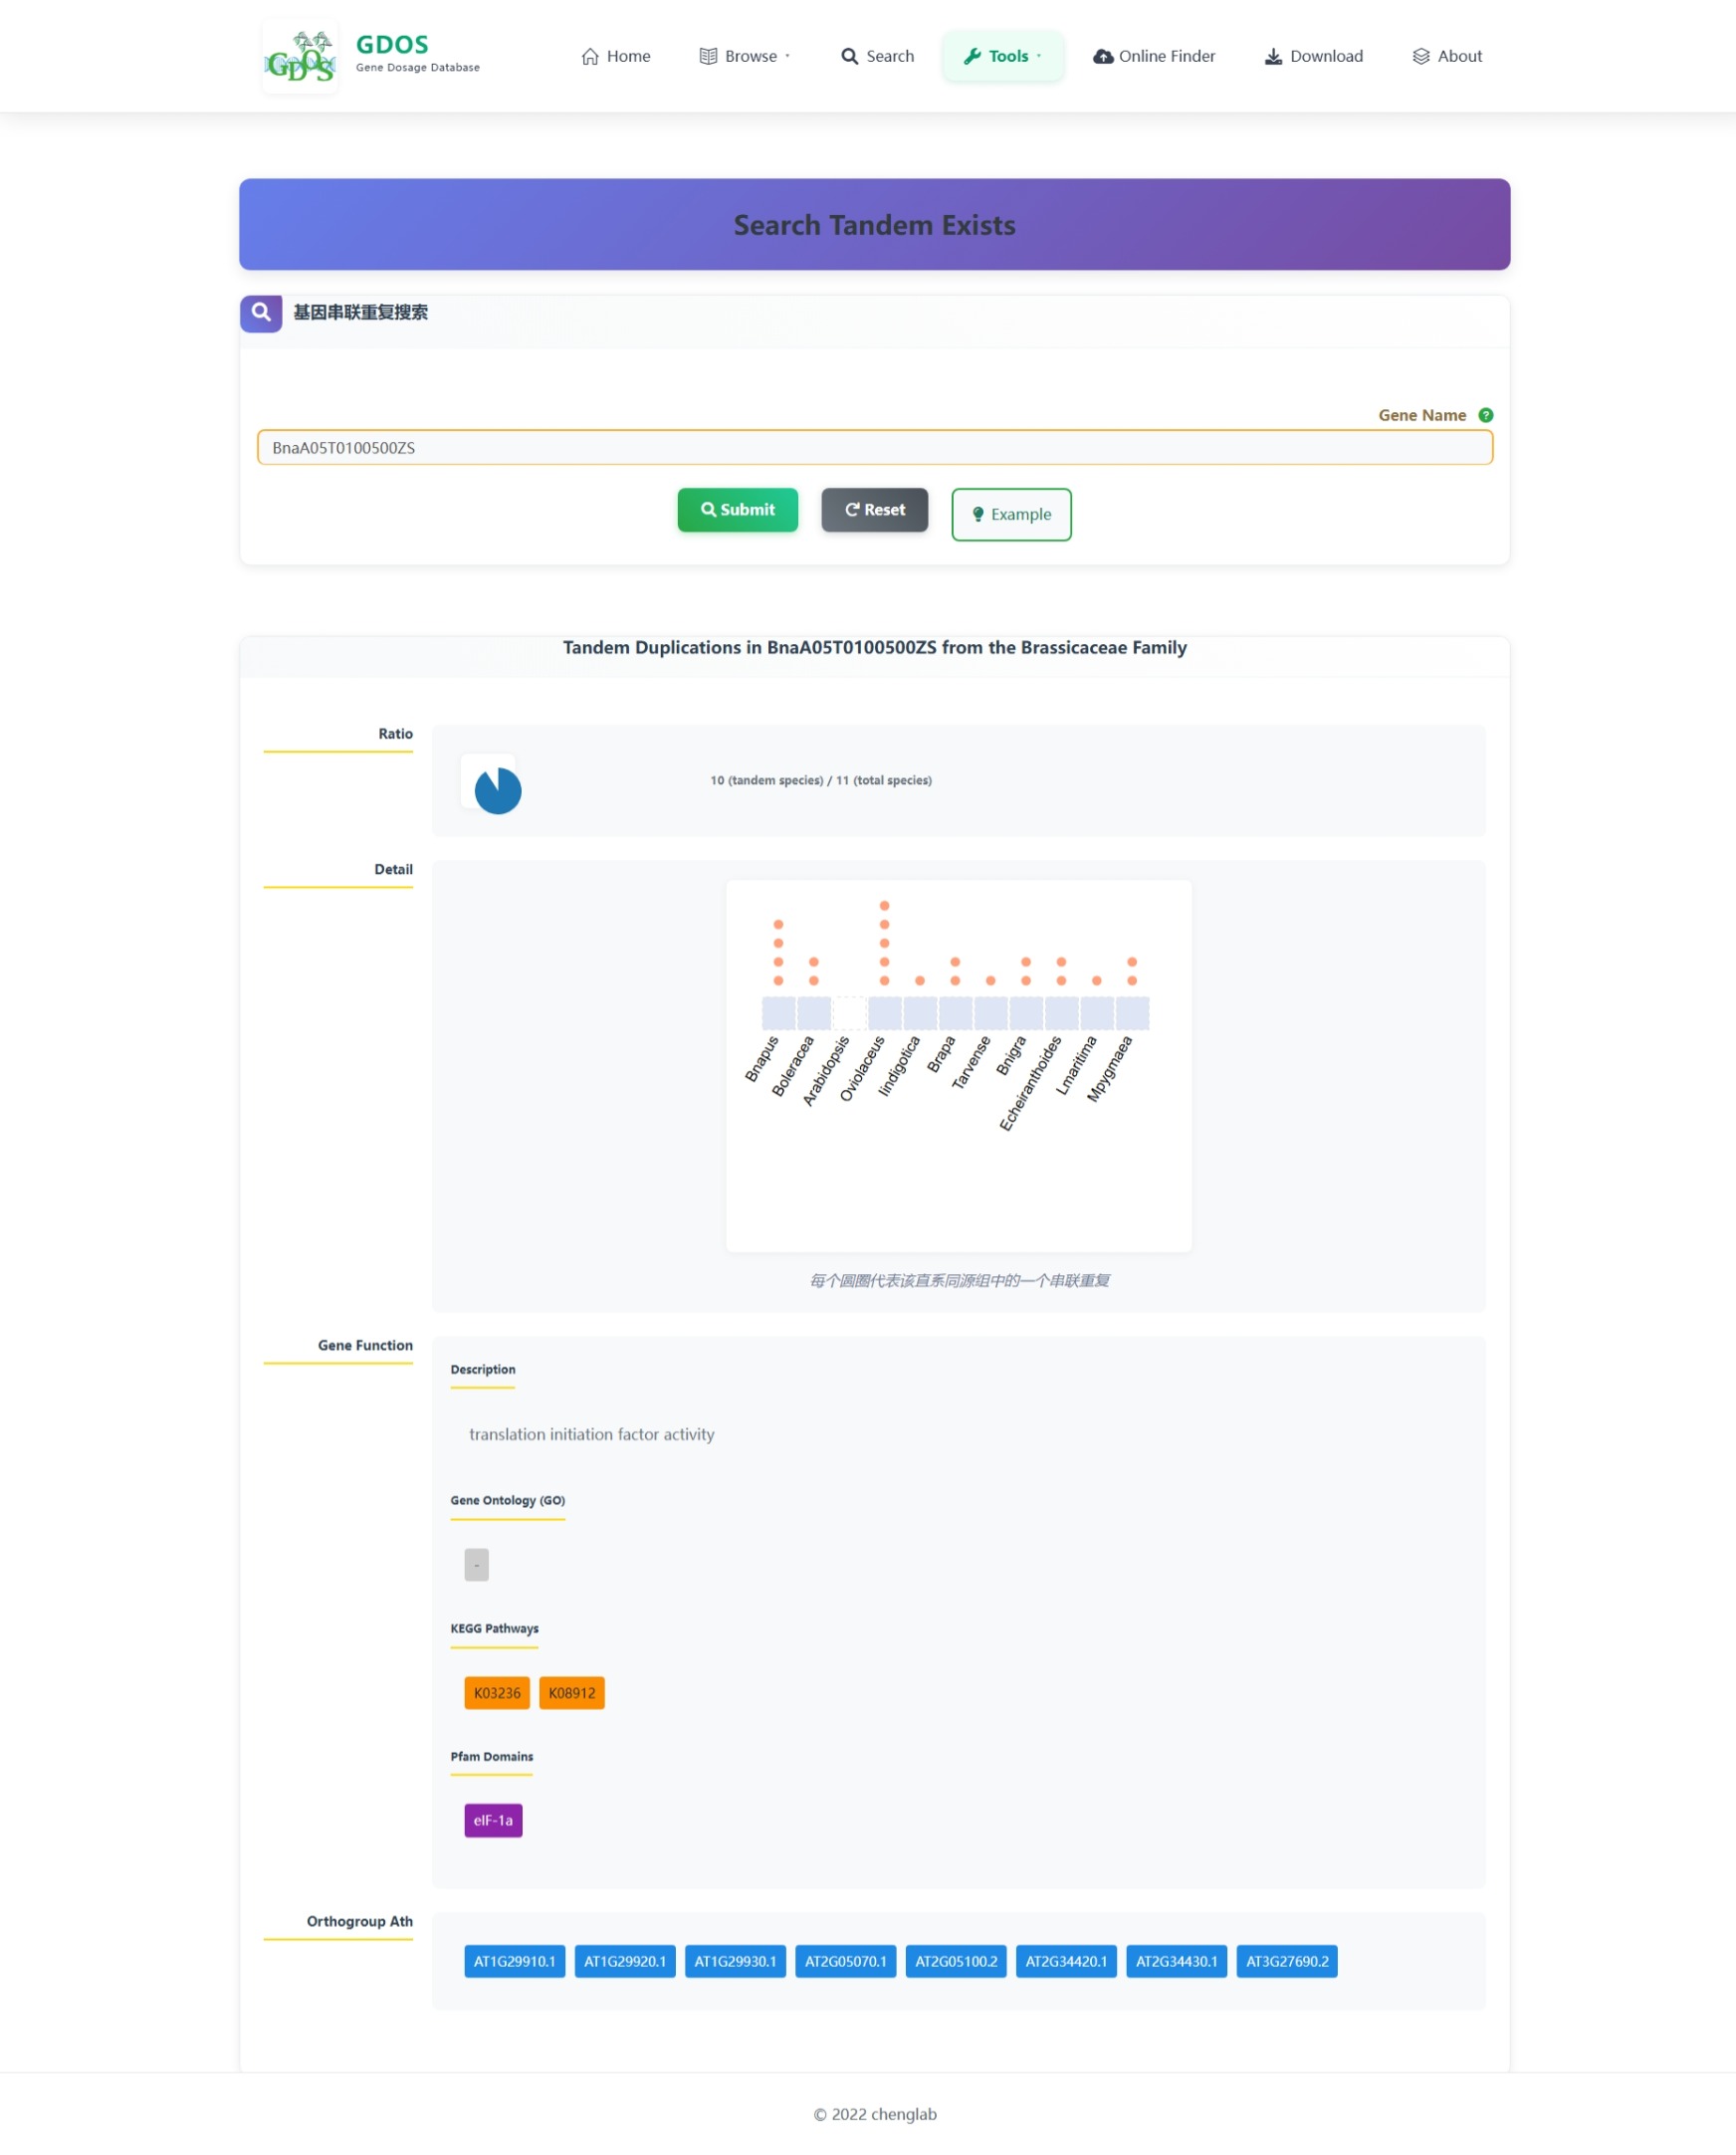
To help users better investigate the evolutionary and domestication-related mechanisms of genes of interest, we provide a Family-Level Tandem Duplication Analysis Tool. Users simply input a gene ID, and the database will automatically analyze the gene’s copy number variation and evolutionary patterns across species within the corresponding taxonomic family. The tool also presents relevant functional annotation information to support comprehensive interpretation.

Family Tandem Distribution
Figure 11: Family Tandem Distribution Analysis

Download Center

On this page, users can download our algorithm pipelines’ source code as well as pre-analyzed dosage gene datasets for all species included in the database.

Download Center
Figure 12: Download Center Page
© 2022 chenglab